
Since the constants are linear, the variable x1 squared can be recoded to x2 and then the equation becomes linear.
Higher power models can be used but are generally not used for business purposes.
Tukey’s ladder of transformation :
A plot of x and y which seems non linear may need transformation for fitting. quadratic polynomial is one such transformation where the data is recoded for better fit. Tukey proposed a series of transformation that can be used to improve the model fit to data. The transformation to be used depends on the shape of the data.(the shape of the scatter plot of the data)
a variable x can be transformed as follows.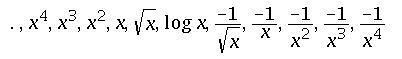
when moving towards higher powers of x, we move up the ladder.
Regression model with interaction :
Two variables in a model may not be independent and may interact in a way such that the effect of one depends on the value of another. This interaction effect can be taken care of by using an interaction variable which is the multiplication of the two variables. The linear regression equation for such a model is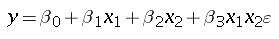
Transforming y variable : In certain cases the y variables needs to be transformed.
for example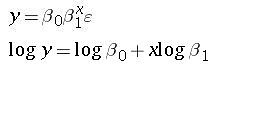
The variable y is transformed but x is not.
Indicator or Dummy variables: Some variables do not have a quantitative effect on the data but may categorize items. These may be ordinal or nominal variables. These variables are included in regression model as dummy variables. example of indicator variable : a survey to find the satisfaction of a customer may have values such as excellent, good , poor etc. Such a variable is called an indicator variable. The indicator variables may be coded using 0 and 1. for example a gender question can be coded to have 1 for female and 0 for male. If there are more than two values then multiple indicator variables can be taken. for example in the earlier example we can have two indicator variables, namely, good and poor. note that the third variable is not required since if the grading is neither good nor poor then it is bound to be excellent. A value of good is coded as good = 1 and poor = 0, a value of excellent is coded as good = 0 and poor = 0.
Also, as a rule of thumb it is generally necessary to have at least three observations per variable to get meaningful and correct model.
Model-building procedures :
Different predictor variables can be used to form a model. For example the price of a commodity may depend on the following – the cost of raw materials, the demand of the item, the cost of competitor’s product etc. The aim of the regression model is to find out the variables which influence the regression model the most, that is the variables that best explain the variance of the dependent model. Also the model needs to be simple. The lesser the number the predictor variables, the better is the model. If a predictor variable adds only marginal variance to the dependent variable, then it is best to ignore that predictor (the more the variables, the tougher it is to collect data and explain to the management).
So how does one select the appropriate model. How does one go about analysing what variables are important.
There are various procedures available to answer these questions. we analyse those procedure below.
All possible regression :
Stepwise regression :
This is the most popular method. It begins with a single variable and adds or deletes variable in each step. In the first step of the procedure all variables are analysed one at a time. The variable yielding the highest value of t is chosen.
In the second step the selected variable is combined with all remaining variables to yield as many models (k variables yield k-1 models in this step). The t value of the added variable is calculated and the variable having the highest t value is selected. However, if while adding another variable the t value of the original variable becomes insignificant then the variable is discarded.
The model continues till all independent variables have been identified.
Forward Selection :
Backward elimination :
multicollinearity :