Statistical hypothesis : This is used to prove or disprove the research hypothesis by providing more measurable or concrete hypothesis statement. for example, a research hypothesis could be that the stock market index reflects the state of monsoon in the country. A statistical hypothesis might look at the values of the index with the percentage increase or decrease in rainfall during the year compared to previous years.
The statistical hypothesis has two parts. The null hypothesis aims to prove that the old standard is correct and the current situation is in control. The alternate hpothesis aims to prove that the new theory is true, new standards are needed or the system is out of control. The null hypothesis is generally something that the experiment would reject to prove the alternative hypothesis. The aim of the experiment is to find cause to reject or not reject the null hypothesis. The null hypothesis is generally represented as H0 (H subscript 0) and the alternative hypothesis as Ha(H subscript a). For example, the number of literate people in the country is 40% and the government wants to prove that because of its literacy schemes the number has increased from 40. The null hypothesis is
H0: p = 40
The alternate hypothesis is Ha: P >40.
Note that in this case p is less than weight =” 40.”
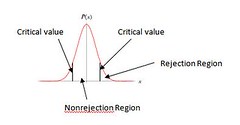
Type 1 error : A type 1 error is commited by rejecting a null hypothesis when it is true. In other words the null hypothesis is true but the experiment prompts the researcher to reject it. The probability of committing a type 1 error is called alpha or level of significance. alpha is the area of the curve under the rejection region lying outside the critical values.
Type 2 error: A type 2 error is committed when a business researcher failes to reject a false null hypothesis. i.e. the null hypothesis is actually false but the experiment prompts the researcher to accept it. The probability of committing a type 2 error is beta. the value of beta varies with the value of probable alternatives and each alternative may have a beta value. note that alpha and beta are inversely proportional. Power = 1- beta is the probability of rejecting a null hypothesis when the hypothesis is wrong. It represents a correct decision.
Using z statistic to test the hypothesis about a population mean :
If the sample size is large i.e. n>= 30 for any population or if x is normally distributed for small population, the z score is given by
The procedure is : use the mean from the null hypothesis and the sigma value to come up with the z score. assume a value of alpha (generally .05) and find out the value of z at the critical value (since alpha is known the area under nonrejected region can be found out. use the table of area under normal distribution and z to find out the z value) if the z from the experiment falls within the z values at critical point the hypothesis is not rejected.
The sample standard deviation can be used if the population SD is not known and n >= 30. If the population is finite i.e. the sample size is a substantial amount of the population then uses the finite correction factor. i.e. if N is the population and n is the sample size, use this formula.
Another method is to convert the z scores at the critical point to the actual critical values and use the critical values to determine the null hypothesis.
The t-statistic (as described in earlier post) can also be used instead of the z statistic of the sample size is small and population is normally distributed.
Hypothesis about the proportion can be tested using the formula
Hypothesis about the variance can be tested using the chi-square method. note again that the chi square method is not robust with respect to normal distribution. i.e. if the distribution is not normal, the chi square method should not be used.