Estimating population mean – Let us first look at estimating the population mean using the z score.
point estimate – If the population mean is assigned the value of the sample mean, then the estimate is called a point estimate. The point estimate may not be accurate, and different samples may have different point estimates. Also the effectiveness may be dependent on how representative is the sample of the population.
Interval estimate – This gives a confidence interval within which the population parameter is expected to lie. Consider the distribution of z scores below.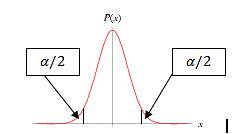
alpha is the area under the normal distribution curve and is the area outside the confidence interval. The 100(1-alpha)% confidence interval is given by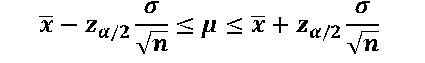
x (bar) is the mean of the sample.
note that sigma is the standard deviation of the population, therefore to calculate confidence interval using this formula, the SD of the population is required. This could be available from previous studies or some other means.
Confidence Interval if population SD is not known : In most cases, the population SD is not known. In these cases the thumb rule is that the sample SD is a good estimation of population SD if n>= 30. To calculate the confidence interval use s (SD of sample) instead of sigma(SD of population) in the equation above.
So far we have seen methods to estimate the population mean and the confidence intervals using the z statistic, let us know look at methods to determine the population mean using t-statistics.
The t-tests can be used to calculate the population mean from the sample mean if the sample size is small. They are also referred to as student’s t tests. The t distribution is given by
The difference between t-test and the z formula is that t-test uses t tables instead of z tables. The t distribution approaches the standard normal curve for large values of n. To find out the t value, the degrees of freedom is required. The degrees of freedom or df is given by n-1. i.e. the df is one less than the number of members in the sample. using the t value and df, the probability value can be obtained from the t table.
similar to calculating the confidence interval using the z table, t-table can also be used to calculate the confidence interval. It is given by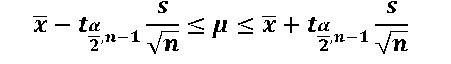
Population proportion : The proportion in a population can be determined given the proportion in a sample using the formula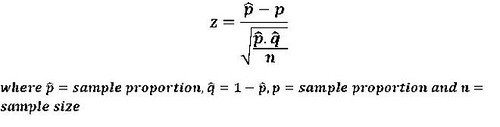
Estimating Population variance :
The population variance can be estimated from the sample variance using the chi-square distribution.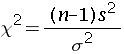
s is the sample variation and sigma is the population variance. The degrees of freedom are given by n-1.the chi-square distribution is not symmetrical and the shape varies with the degrees of freedom.
The confidence interval is given by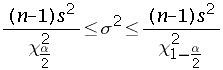
Sample Size : The size of the sample to be used for survey can be calculated if the error in estimation E =(sample mean – population mean) is known. The size is given by
The sample size to estimate the proportion p is given by