Multiple Regression Model :
The multiple regression model is of the form.
where y = the value of the dependent variable.
beta0 = the regression constant.
beta1 = partial regression coefficient for independent variable 1.
beta2 = partial regression coefficient for independent variable 2.
k = the number of independent variables.
The partial regression coefficient of the independent variable beta is the change in the dependent variable by a unit change in the independent variable.
Multiple regression model with two independent variables :
In this case we obtain a regression plane that fits the data. The multiple regression equation is given by;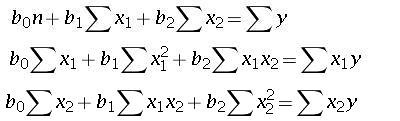
This equations are obtained by minimizing the sum of square of error.
Testing the Multiple Regression Model:
The overall model can be tested by using the hypothesis of the form.
Null Hypothesis: beta1=beta2=betak= is equal to 0.
Alternate Hypothesis: at least one of the beta is not equal to 0.
This test can be used to establish that the data does indeed have a relationship between the independent and the dependent variable(s).
A rejection of null hypothesis indicates that at least one of the independent variables predicts the dependent variable.
The F value test can be used to check the hypothesis.
The F value is given by:
where
MS=mean square;
SS=sum of squares;
df=degrees of freedom=N-k-1;
k=number of independent variables.
N=number of observations.
A significance test can also be undertaken for each regression coefficient to validate whether each of them is significant. A t-test can be used for this purpose.
Residuals:
The residual can be calculated by solving the multiple regression equation and obtaining the dependent variable. The difference between the value obtained from the calculation and the value obtained from observation is the residual value. A plot of residuals can be used to identify the fit of the plot and can also be used to identify outliers.
Standard Error Of Estimation:
The sum of residuals is equal to zero if rounding errors are not considered. Therefore the sum of squares of error can be used to find the error in estimate.
the sum of squares of error or SSE is given by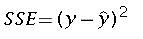
The standard error of estimate (standard deviation of error for the regression model) can be estimated using: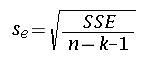
The assumption in regression is that the errors follow a normal distribution. The standard error of estimate can be used to verify this assumption. (we know that for a normal distribution 68% of values fall with one standard deviation of the mean and 95% fall within two standard deviations.)
Coefficient of multiple Determination (R squared) :
The coefficient of multiple regression accounts for the proportion of the variation of the dependent variable y by the independent variable. a value of 0 indicates no relationship and a value 0f 1 indicates perfect relationship. The coefficient is given by: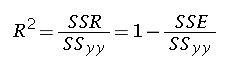
SSR = sum of squares of regression, SSE = sum of squares of error and SSyy is the sum of squares total. These values can be obtained by ANOVA analysis.
Adjusted R square :
As variables are added to the regression model the R squared value keeps on increasing. However, sometimes even if the new variable added does not have a significant effect on the y variable, the R squared value increases. To take care of this effect an adjusted R squared value is used. The value is given by: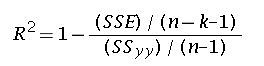
To summarize, to check the results of multiple regression, the following needs to be checked.
1. the regression model equation.
2. The ANOVA table and the F value of the overall model.
3. SSE values.
4. standard error of estimate.
5. coefficient of multiple determination.
6. adjusted coefficient of multiple determination.
“This equations are obtained by minimizing the sum of square of error.”
It’s worth noting that least squares regression is not the only type. In fact, least absolute errors regression (also called ‘L-1 regression’) pre-dates least squares. A wide variety of other regressions, such as robust regression have been devised which involve various behavioral trade-offs versus least squares.
See, for example: L-1 Linear Regression
Thanks for pointing that out. Will read about it and will modify the post accordingly.