ANOVA – Analysis of variance – This is a methodology in which the researcher studies the variance in a dependent variables due to the other independent variables. This technique attempts to calculate the contribution of variance by each independent variable. Various types of experiments are available; we discuss some of those.
One way Anova – Completely randomized design :
In this experiment, there is only one independent variable. The variable contains more than one classification level. If only two classification levels are present, the design is same as comparing the statistic of two populations. An example of using a one way Anova is a comparison of car music systems where the sound quality is compared. The kinds of music systems are the classifications of the independent variable and the dependent variable is the sound quality. ( can be quantified using a suitable measurement). In general, if k samples are analysed the null hypothesis for one way ANOVA states that the mean of all the samples is same. If any one of the mean is different from the others, the hypothesis is said to be rejected.
ANOVA basically compares the relative size of the treatment variables (independent variables) variation and the error variation (accross treatment groups and within treatment groups). The one way ANOVA can be calculated by ;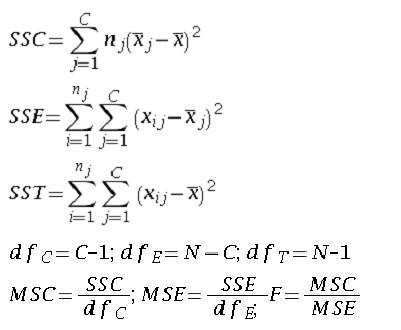
Where SS is the sum of squares and MS is the mean square. SSC is the sum of square columns which gives the sum of squares between treatments. SSE is the sum of squares of error. The F value is the ration of treatment variance to the error variance.
The t test can be considered a special case of two way Anova where there are only two treatment variables.
Once the one way ANOVA using F test establishes that a significant difference exist in different treatments, multiple comparisions can be done to find out which pairs are different. t-tests can be used but the error adds up in that case. Other techniques have been developed for multiple comparisons.
Tukey’s Honestly Significance Test (HSD) Test – This method is a multiple comparison test where the sample are of equal sizes. The HSD value is given by
The difference in means of pairs are compared to this HSD value and the pair that has the mean difference greater than the HSD value is said to different at that alpha level.
Tukey–Cramer procedure – This method is used for multiple comparisons when the samples are of unequal sizes.
The formula is
Randomized block design : This is the second method of analysis which considers another variable in addition to the treatment variable. This another variable is called the confounding variable. These are variables which are not controlled during the experiment, but have an effect on the outcome of the experiment.
The randomized block design test adds an additional variable that the experimenter cannot control. this variable is also called the blocking variable. In this experiment SSE is broken into SSE and SSR (sum of squares for the block variable).
The formula is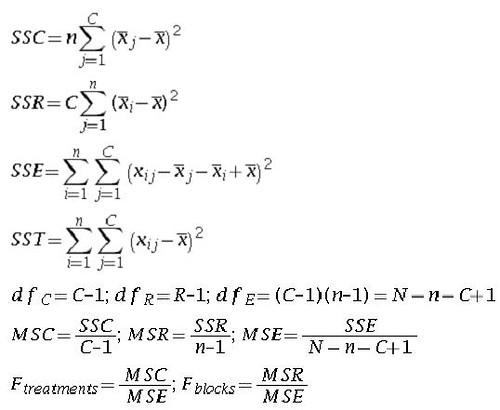
TWO WAY ANOVA : Factorial design – In this procedure two or more variables are explored simultaneously. Every level of each treatment is studied under the condition of every level of all other treatments. For factorial design of two variables, a two way ANOVA can be used. Note that the randomized block design is different from this in that it cannot measure the interaction between the two variables. The null hypothesis for two way anova is
i. Row effects – The row means are all equal.
ii. column effects – the column means are all equal.
iii. the interaction effects are zero.
The two way anova can be calculated by
Interaction effects show that the variation in the column values are dependent on which row is selected. whenever the interaction values are significant the row and column effects should not be considered.
note: The method of analysis for ANOVA is as follows – compare the F values calculated from the formula with the F values obtained from the table using the degrees of freedom specified in the formula and a suitable alpha value. If the F value calculated from the experiment is greater than the F value from the table then the null hypothesis for the F value experiment is said to be rejected.
Links:
1) http://www.southampton.ac.uk/~cpd/anovas/datasets/index.htm
2) http://faculty.chass.ncsu.edu/garson/PA765/anova.htm